

Key Takeaways
- The national average rent was $1,663 per month, an increase of 0.8% over the last year.
- Illinois dethroned West Virginia for the state with the biggest year-over-year rent increase, with rents 3.3% higher than last year.
- Rents in the Boston area are about 4% higher than last year as the rental market prepares for competition leading up to the citywide moving day.
In July, the national average rent was $1,663 per month for a one-bedroom and $1,930 per month for a two-bedroom, an increase of 0.8% from July 2025. The national vacancy rate dropped to 8.1%, just slightly below where it was a year ago.
Boston Braces for Moving Day
Demand spiked in the Greater Boston area as the city’s moving day creeps closer.
In Boston, most rental leases turn over on Sept. 1 every year, making summertime extra competitive as renters prepare for moving day.
This summer was no different. Vacancies dropped to 5.7% after a supply spike mid-2025, with luxury units seeing the most lease-up activity. The city’s average rent has increased by 5.2% since March, from $3,454 per month to $3,632 per month.
Boston’s strict leasing cycle means there are more distinct fluctuations in supply and demand than in other markets; vacancies begin to decline in the spring and summer, drop to their lowest in the fall, then immediately rise in the winter. Rent prices follow the opposite pattern, rising through spring and summer to a peak in the fall, then dropping in the winter.
Matt Giordano, associate director of market analytics covering Boston for CoStar Group, says that leading up to Sept. 1, “negotiating leverage is more difficult compared to other times of the year, such as winter or early spring.” This is especially true the closer renters get to the city center and university campuses.
While renters may use the off-season to their advantage, Boston’s strict leasing cycle and extreme winter weather significantly limit renters’ flexibility in apartment searching and moving.
“The weather is a major component as well,” says Giordano. “It’s easier to move in the summer instead of moving furniture after a snowstorm.”
July 2026 Rent Growth
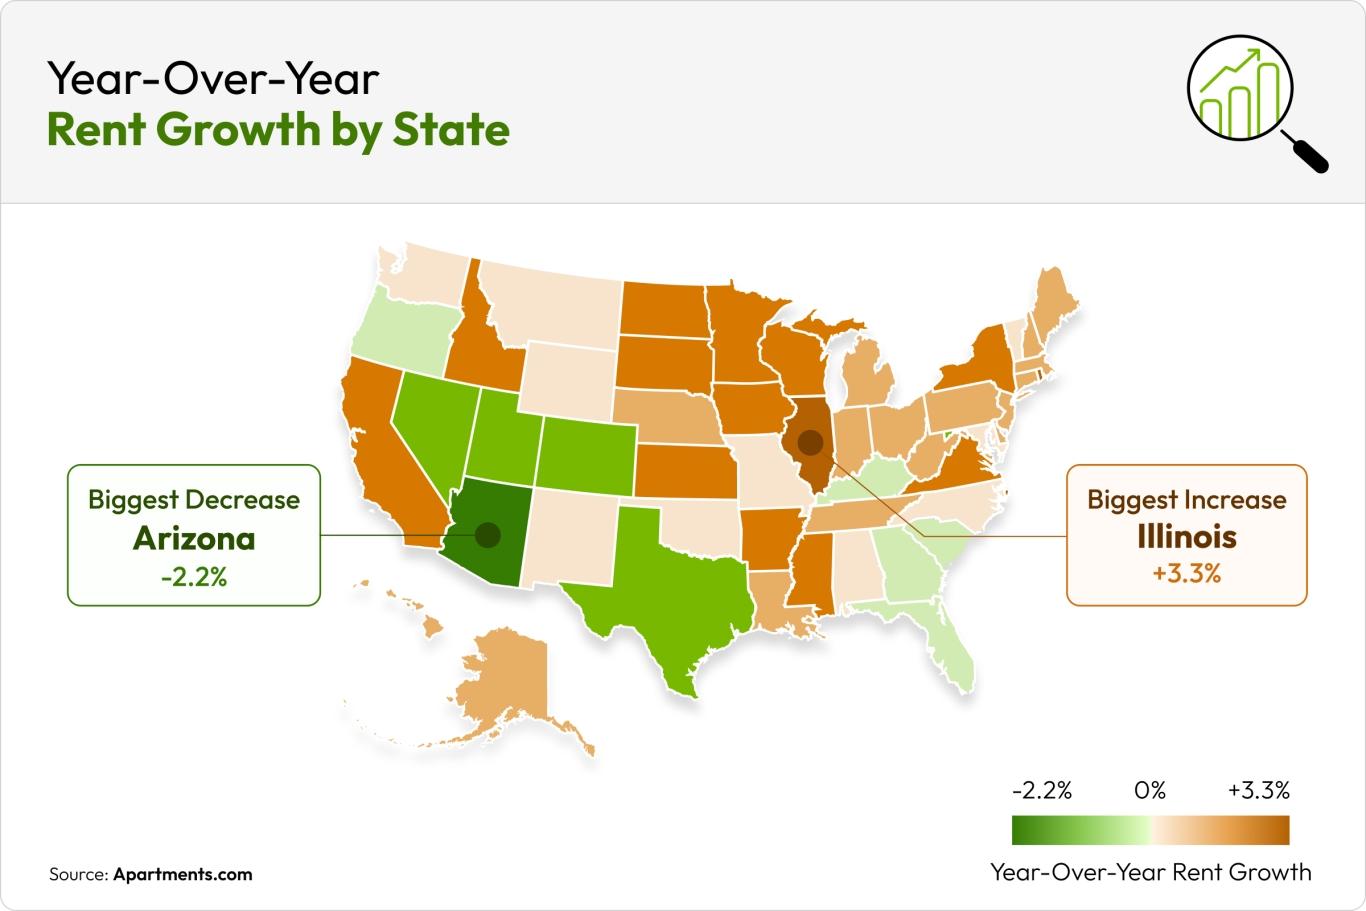
Illinois had the greatest year-over-year increase at 3.3%, and Arizona had the largest decrease at -2.2%.
July 2026 rent increases by city
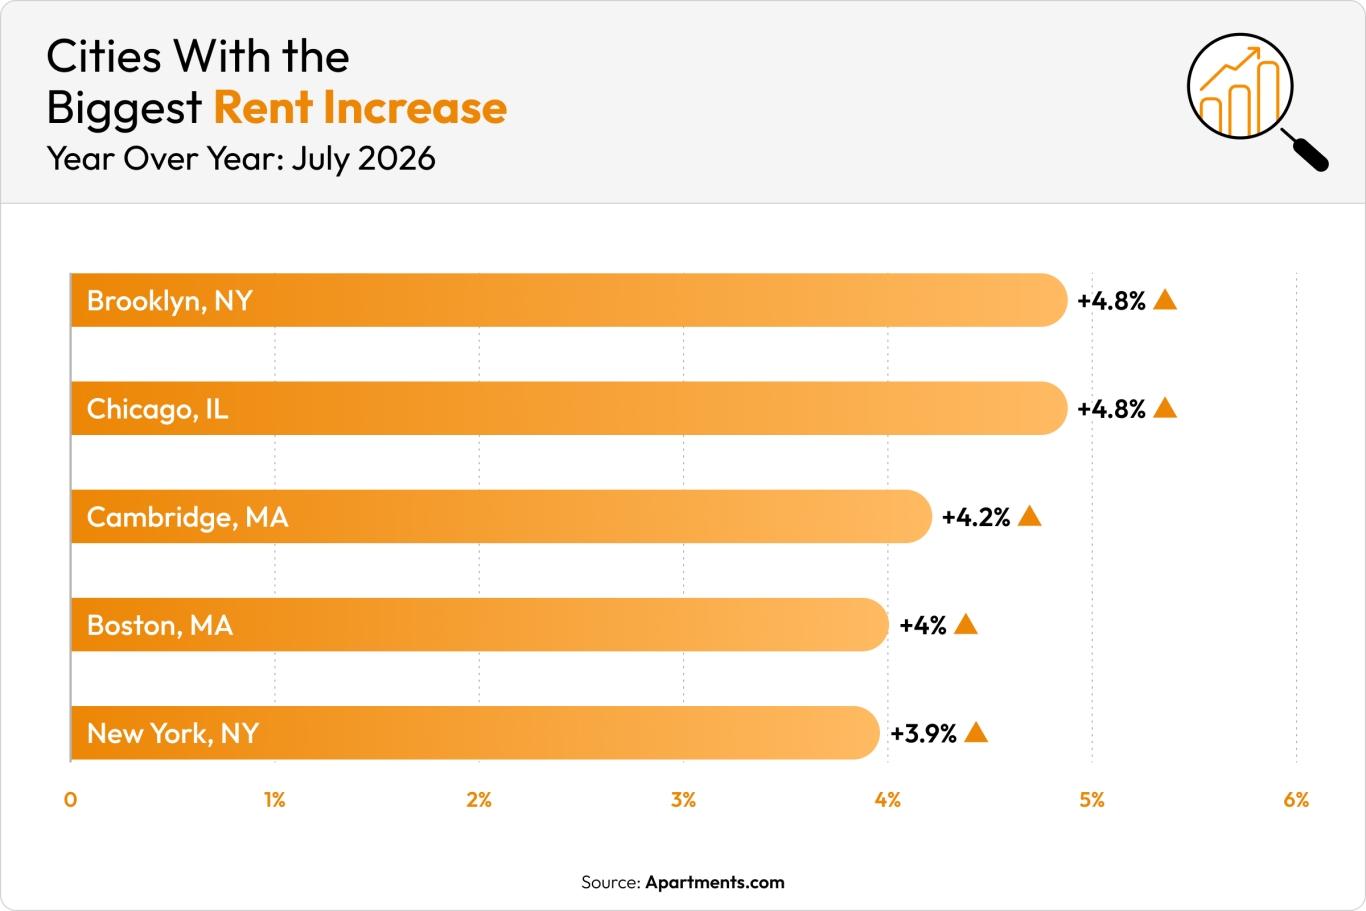
Brooklyn, NY, and Chicago tied for the biggest year-over-year rent increases in July, with rents 4.8% higher than last year.
Here are the cities with the biggest rent increases in July:
- Brooklyn, NY: +4.8%
- Chicago, IL: +4.8%
- Cambridge, MA: +4.2%
- Boston, MA: +4.0%
- New York, NY: +3.9%
July 2026 rent decreases by city
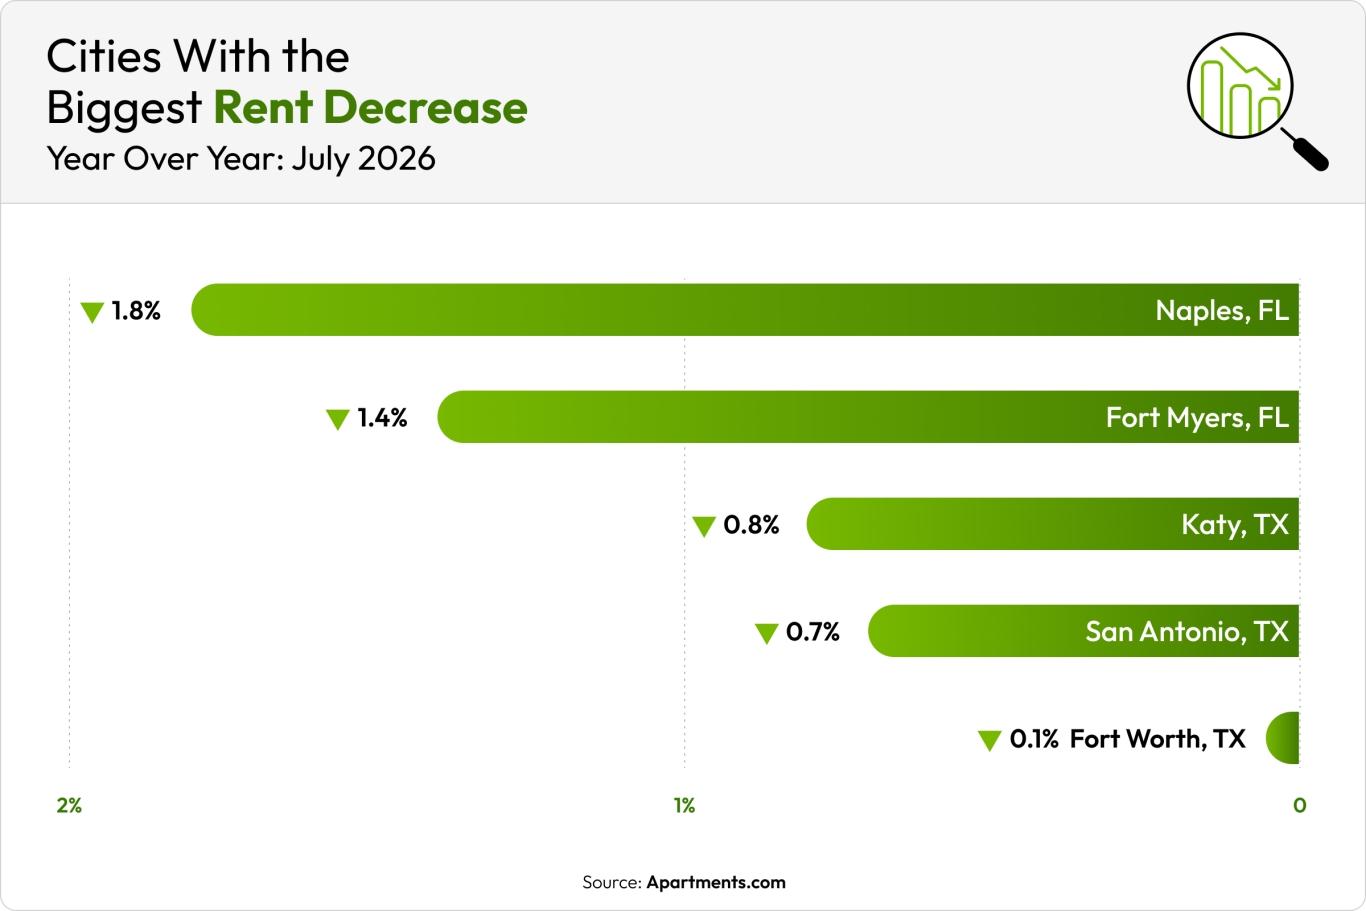
Southwest Florida has been leading the nation in rent decreases across for the past year. Fort Myers occupied the top spot from January to June but fell behind Naples in July.
Here are the cities with the biggest rent decreases in July:
- Naples, FL: -1.8%
- Fort Myers, FL: -1.4%
- Katy, TX: -0.8%
- San Antonio, TX: -0.7%
- Fort Worth, TX: -0.1%
Current Rent Prices Across the U.S.
|
City |
Current Average Rent |
Last Month’s Average Rent |
Year-Over-Year Difference |
|
$2,401 |
$2,387 |
+2.2% |
|
|
$1,658 |
$1,645 |
+1.5% |
|
|
$1,420 |
$1,411 |
-0.2% |
|
|
$3,632 |
$3,614 |
+4.3% |
|
|
$1,655 |
$1,638 |
+0.4% |
|
|
$3,064 |
$3,050 |
+1.8% |
|
|
$1,935 |
$1,929 |
+4% |
|
|
$1,477 |
$1,481 |
-0.8% |
|
|
$2,054 |
$2,055 |
+4.3% |
|
|
$1,145 |
$1,141 |
+1.3% |
|
|
$1,304 |
$1,299 |
+0.6% |
|
|
$1,186 |
$1,185 |
+1.8% |
|
|
$1,410 |
$1,416 |
+0.2% |
|
|
$1,642 |
$1,634 |
+0.4% |
|
|
$2,292 |
$2,277 |
+0.4% |
|
|
$1,273 |
$1,271 |
-0.4% |
|
|
$3,866 |
$3,843 |
+1.8% |
|
|
$1,788 |
$1,753 |
+3.1% |
|
|
$1,181 |
$1,184 |
-0.9% |
|
|
$1,127 |
$1,134 |
+0.9% |
|
|
$2,980 |
$2,961 |
-1% |
|
|
$1,305 |
$1,307 |
+1% |
|
|
$3,291 |
$3,281 |
+2.5% |
|
|
$1,263 |
$1,262 |
+2.7% |
|
|
$1,266 |
$1,277 |
-1.3% |
|
|
$1,855 |
$1,834 |
+1.8% |
|
|
$2,186 |
$2,185 |
-0.3% |
|
|
$1,514 |
$1,521 |
+0.7% |
|
|
$2,248 |
$2,243 |
+1.5% |
|
|
$1,222 |
$1,220 |
+2.4% |
|
|
$1,425 |
$1,424 |
+2.6% |
|
|
$1,702 |
$1,693 |
+0.3% |
|
|
$4,193 |
$4,183 |
+3.1% |
|
|
$1,585 |
$1,591 |
+0.1% |
|
|
$1,787 |
$1,785 |
+2.8% |
|
|
$1,304 |
$1,300 |
-1% |
|
|
$1,454 |
$1,442 |
+2.9% |
|
|
$1,529 |
$1,523 |
+0.8% |
|
|
$3,600 |
$3,588 |
+2.7% |
|
|
$1,391 |
$1,393 |
+1.4% |
|
|
$1,438 |
$1,440 |
+1.3% |
|
|
$1,583 |
$1,578 |
-0.2% |
|
|
$1,159 |
$1,158 |
+1.8% |
|
|
$1,074 |
$1,072 |
-1% |
|
|
$2,432 |
$2,413 |
+0.7% |
|
|
$3,541 |
$3,469 |
+11.6% |
|
|
$2,845 |
$2,816 |
+6.7% |
|
|
$2,119 |
$2,113 |
+0.4% |
|
|
$1,653 |
$1,654 |
-0.3% |
|
|
$2,291 |
$2,279 |
+0.3% |
How Current Rent Prices Impact Renters
Timing is key when you’re searching for a new place. Rent prices are always fluctuating, and summer is a peak demand time. Fall and winter are typically the best times to find cheap rent, so renters will find the best deals in the coming months. Keep an eye out for rent concessions like waived application fees or a free month of rent.
Need help comparing cities? Our Cost of Living Calculator makes it easy. You can also compare the rent prices from this report to those from June and May to determine the overall trend and visit the U.S. Rent Trends page to view the most current rent prices available across the U.S.
Methodology:
The rent data in this report is sourced from CoStar Group’s Market Trend reports. CoStar Group is the leading authority in commercial real estate information, analytics, and news, trusted by real estate professionals for nearly 40 years. By combining this data with Apartments.com internal data and public record, we’re able to deliver the most up-to-date rental information available.
To determine overall rent trends, we evaluate rent prices from more than 2,400 cities across the nation, including the top 80 national markets. This analysis includes year-over-year and month-over-month rent changes to provide a comprehensive view of market dynamics. This report covers a diverse range of property types to ensure a holistic view of the rental market.
FAQs
What is the average rent in the U.S. right now?
The average rent in the U.S. is currently $1,663 per month, a year-over-year increase of 0.8%.
Which states had the largest rent increases in July 2026?
The states with the largest rent increases in July were Illinois, Rhode Island, and Idaho. Illinois’ average rent increased by 3.4% compared to last year, Rhode Island’s average rent increased by 3.2%, and Idaho’s average rent increased by 2.8%.
Which states have the cheapest rent right now?
The states with the cheapest rent are Oklahoma, Arkansas, and West Virginia. Oklahoma has the cheapest rent in the U.S. at $920/month, a 0.3% increase over last year.
Are rent prices rising or falling in the U.S.?
Rent prices in the U.S. are rising, averaging 0.8% more than last year.


