
Century Tower
182 W Lake St,
Chicago, IL 60601
$1,920 - $2,862
Studio - 2 Beds


Area Guide
The Loop serves as Chicago’s downtown district and is home to many of the city’s most famous landmarks: the Willis Tower (formerly the Sears Tower), Buckingham Fountain, and City Hall, to name just a few. The skyline is dominated by skyscrapers representing well over a century’s worth of architectural designs and styles, from the earliest Victorian-era high-rises to ultra-modern glass towers and everything in between.
What’s it like to live in the Loop? The neighborhood is loaded with everyday attractions like the lakefront, which gives the neighborhood stunning waterfront views. The dining scene is incredible, with world-class food of every description readily available anywhere you look. The nightlife incorporates everything from dives and corner taverns to swanky nightclubs and cocktail bars. Renters pay a premium to live here, but they get to enjoy all the benefits of having the very best of Chicago right at their doorstep.
Elevated train tracks above the streets in the Loop
A lovely summer day on the Chicago river
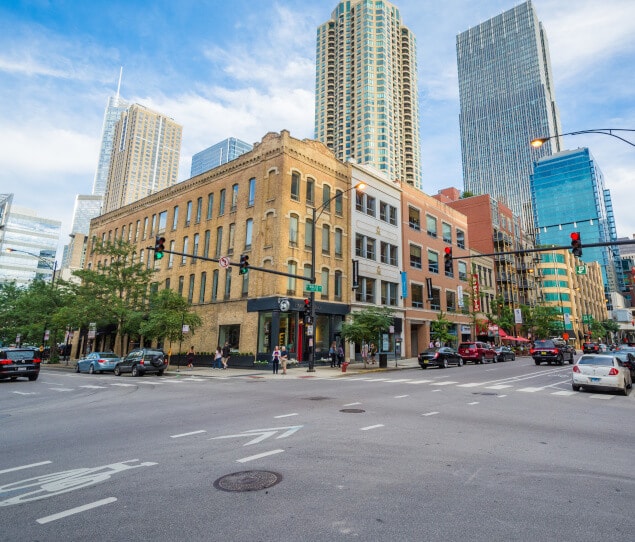
A busy street in the heart of the Chicago Loop
As of May 2026, the average apartment rent in Chicago Loop is $2,271 for a studio, $2,747 for one bedroom, $3,977 for two bedrooms, and $5,774 for three bedrooms. Apartment rent in Chicago Loop has increased by 1.7% in the past year.
Studio
586 sq ft
Average Sq Ft
$2,271/month
Average Rent
1 BR
764 sq ft
Average Sq Ft
$2,747/month
Average Rent
2 BR
1,144 sq ft
Average Sq Ft
$3,977/month
Average Rent
3 BR
1,656 sq ft
Average Sq Ft
$5,774/month
Average Rent
Explore how walkable, bikeable, drivable, and transit-friendly Chicago Loop - Chicago, IL is for everyday living.
Exceptionally Walkable
Walkability
Exceptional Public Transit
Transit
Fairly Drivable
Drivability
Very Bikeable
Bikeability
In Chicago Loop - Chicago, IL, daily errands are quick and hassle-free.
Supermarket Within a 5 Minute Walk
Groceries
Exceptional Restaurant Variety Nearby
Restaurants
Exceptional Café Variety Nearby
Cafes
Exceptional Variety of Shops Nearby
Shopping
Chicago Loop - Chicago, IL provides ample green space and fitness centers within easy reach.
Exceptional Amount of Park Space Nearby
Parks
Exceptional Wellness Amenity Variety Nearby
Wellness
Get a sense of what it’s like to live in Chicago Loop - Chicago, IL from everyday activity to noise and nightlife.
Exceptionally Vibrant Atmosphere
Vibrancy
Exceptional Nightlife Variety Nearby
Nightlife
Extremely Noisy
Quiet Score

3,524
Communities
969,267
Units
896
Cities

716
Communities
197,384
Units
337
Cities

663
Communities
183,254
Units
260
Cities

610
Communities
122,185
Units
245
Cities

570
Communities
127,214
Units
220
Cities

450
Communities
106,486
Units
224
Cities
† Our analysis of utilities, groceries, transportation, healthcare, home prices, and other goods and services is sourced from the Cost of Living Index, a respected benchmark published by the Council for Community and Economic Research (C2ER) that provides a thorough overview of living expenses across different regions.
Rent data is provided by CoStar Group’s Market Trend reports. As the industry leader in commercial real estate information, analytics, and news, CoStar conducts extensive research to produce and maintain a comprehensive database of commercial real estate information. We combine this data with public record to provide the most up-to-date rental information available.
Consumer goods, services, and home prices are sourced from the Cost of Living Index published by the Council for Community and Economic Research (C2ER). The data on this page is updated quarterly. It was last published in February 2026.
Demographic information comes from Neustar and combines detailed address data with U.S. Census and American Community Survey statistics to produce reliable local estimates.


