
SoLA
10930 Garfield Ave,
South Gate, CA 90280
$3,150 - $3,999
1-3 Beds

Welcome to Downey, a historic Los Angeles County community 13 miles southeast of downtown Los Angeles. The city offers various housing options from single-family homes to modern apartment communities. Current rental trends show one-bedroom apartments averaging $1,704 per month and two-bedroom units at $2,095. The downtown district features the Downey Theatre and local dining establishments, while north Downey is recognized for its established neighborhoods near Stonewood Center mall.
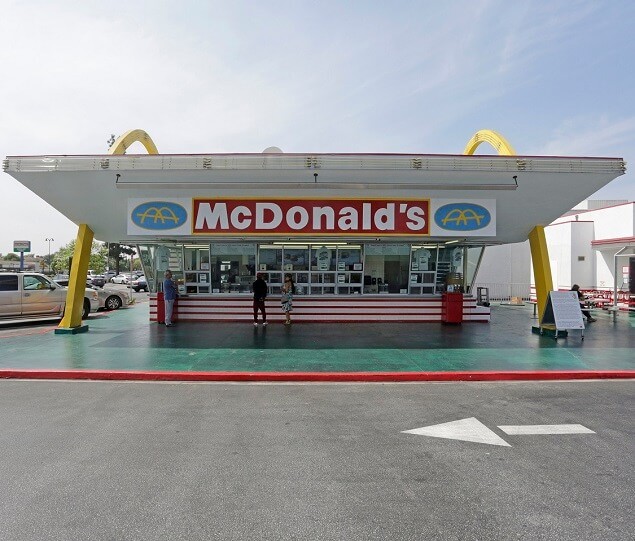
The Columbia Memorial Space Center celebrates Downey's aerospace history as the birthplace of the Apollo space program. Residents enjoy outdoor recreation at Dennis the Menace Park and Furman Park. The city is home to the original McDonald's restaurant, a historic landmark complete with a museum showcasing the chain's beginnings. Community events throughout the year include the Downey Street Faire and summer concerts in the park. With access to four major freeways, multiple shopping areas, and the Stonewood Center, Downey combines suburban living with easy access to greater Los Angeles.
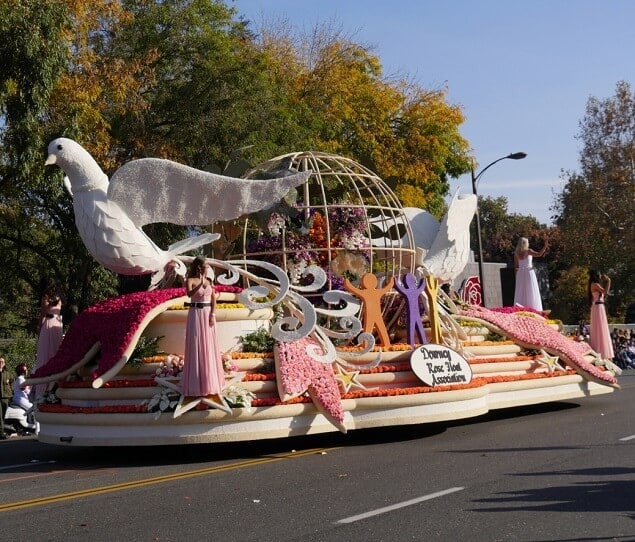
The Downey Rose Float Association has taken part in the Rose Bowl Parade since 1913
Downey is home to the oldest operating McDonald's Restaurant
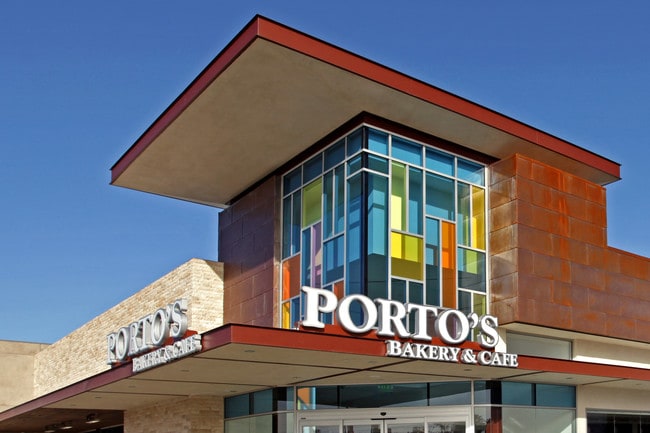
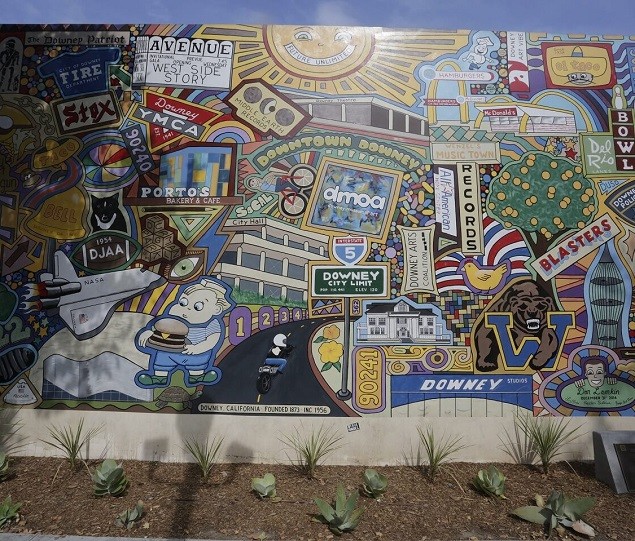
The "Downey Doodle-icious" public art mural is located near Porto's Bakery
The 100-year-old Hay Tree is where farmers once gathered to set the price of hay around the world
Downey Gateway is a popular shopping and dining destination
Downey is home to several neighborhood parks
As of March 2026, the average apartment rent in Downey, CA is $1,255 for a studio, $1,738 for one bedroom, $2,229 for two bedrooms, and $2,780 for three bedrooms. Apartment rent in Downey has decreased by -0.9% in the past year.
Explore how walkable, bikeable, drivable, and transit-friendly Downey, CA is for everyday living.
Moderately walkable
Walkability
Some public transit
Transit
Very drivable
Drivability
Fairly bikeable
Bikeability
Public
Grades K-5

Public
Grades K-5

Public
Grades K-5

Public
Grades K-5
Public
Grades K-5
Public
Grades 6-8
Public
Grades 6-8

Public
Grades 6-8
Public
Grades 6-8
Los Angeles County Special Education
Public
Grades K-12
208 Students

Public
Grades 9-12
Public
Grades 9-12
Los Angeles County Special Education
Public
Grades K-12
208 Students

40
Communities
2,056
Units
20
Cities

142
Communities
4,236
Units
38
Cities

52
Communities
2,500
Units
31
Cities

64
Communities
11,801
Units
29
Cities

3,483
Communities
955,861
Units
894
Cities

626
Communities
125,316
Units
245
Cities
† Our analysis of utilities, groceries, transportation, healthcare, home prices, and other goods and services is sourced from the Cost of Living Index, a respected benchmark published by the Council for Community and Economic Research (C2ER) that provides a thorough overview of living expenses across different regions.
Rent data is provided by CoStar Group’s Market Trend reports. As the industry leader in commercial real estate information, analytics, and news, CoStar conducts extensive research to produce and maintain a comprehensive database of commercial real estate information. We combine this data with public record to provide the most up-to-date rental information available.
Consumer goods, services, and home prices are sourced from the Cost of Living Index published by the Council for Community and Economic Research (C2ER). The data on this page is updated quarterly. It was last published in February 2026.


