
6615 Flora Ave S
6615 Flora Ave S,
Seattle, WA 98108
$2,250 | 1 Bed
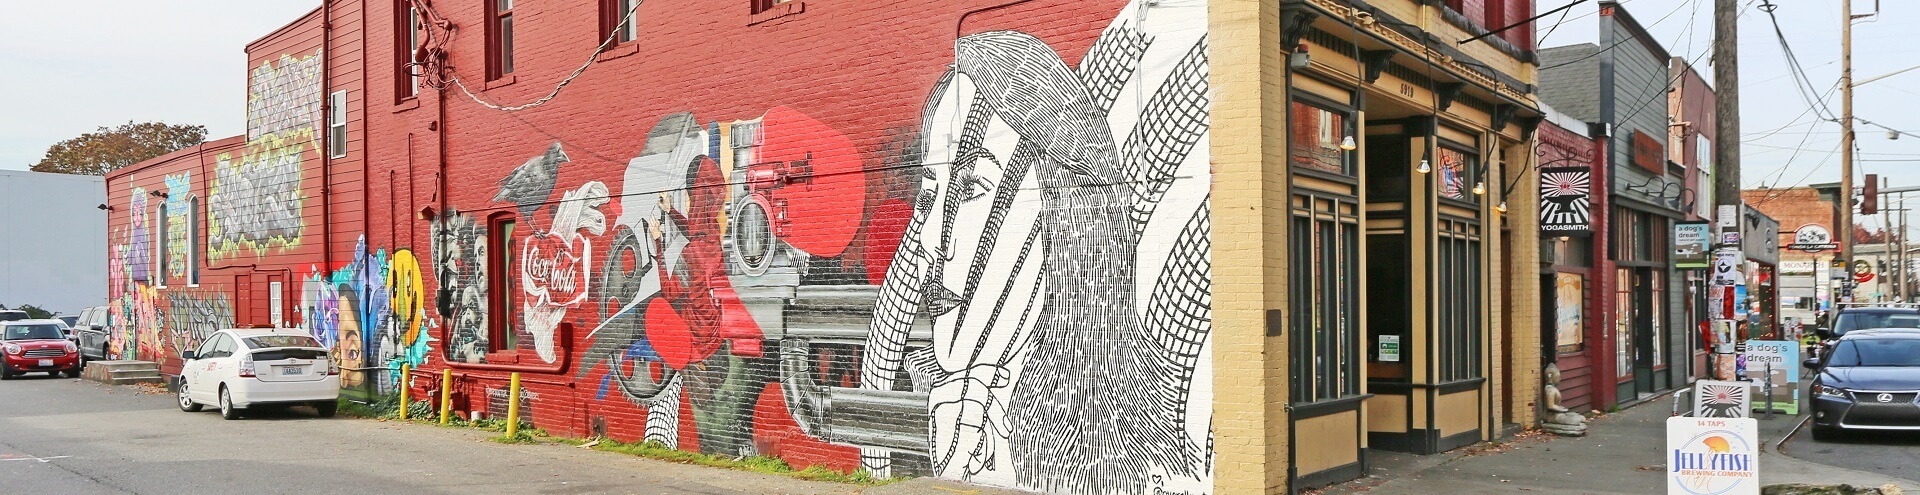
As Seattle’s oldest neighborhood, Georgetown was settled in the 1850s. It quickly became an industrial center, filled with brick warehouses and a few taverns. It was where Seattle residents came to work or play, but not to live. That all changed as the warehouses were slowly converted into lofts and artists began to move in. Today, Georgetown is hip, trendy, and a little bit quirky.
Georgetown is wedged between I-5 and the Duwamish Waterway, directly south of the Industrial District. It is less than four miles from Downtown Seattle. Industry still resides here – the neighborhood is home to Boeing, several distribution centers, and businesses like Grainger Industrial Supply. But this just adds a layer of gritty authenticity to Georgetown and makes the art galleries and breweries that much more interesting. Be sure to visit local favorites like Georgetown Brewery, Emerald City Beer, or Machine House Brewery.
If you love thrift stores and vintage shops, then you’ll love the Trailer Park Mall. This unique shopping experience involves vintage trailers hauling everything from works of art to second-hand clothing. The large number of artists in the neighborhood lend to events like Art Attack, a once-a-month street festival featuring the works of local artists.
A large, orange cowboy hat serves as part of the roadside attraction, “Hat ‘n’ Boots”
The “Hat ‘n’ Boots” statues were built in 1954 and are located in Oxbow Park
Each of the trailers in the Georgetown Trailer Park Mall is an independently-owned, permanent shop
Local favorite Fonda La Catrina serves up Mexican cuisine
The Georgetown Ballroom is located in a historic building that once served as a warehouse garage and the Mission Theater
The historic Seattle Brewing and Malting Co. building dates back to 1900
As of April 2025, the average apartment rent in Georgetown is $1,426 for one bedroom. Apartment rent in Georgetown has increased by 0.8% in the past year.
1 BR
536 sq ft
Average Sq Ft
$1,426/month
Average Rent
Somewhat Walkable
out of 100 WalkScore® Rating
You might be able to get out and walk when living in this area. Some errands can be accomplished on foot, but for others you’ll need a car.
Some Transit
out of 100 TransitScore® Rating
You'll likely want a car when living in this area since it has few transit options.
Very Bikeable
out of 100 BikeScore® Rating
This area is very bikeable. You’ll find a variety of bike paths and lanes.
Current Resident
5 years and 8 months ago•Niche Review
Georgetown has some cool restaurants and things to do but as a minor it feels pretty limited. There are only a few places that you can go that are family friendly. This neighborhood is getting pretty expensive now but it is still not very safe and can be pretty dirty as well. I would never walk there alone at night. One good thing though, is that there seems to be a pretty good community with those that live here and there are community meetings where people discuss how to help the health and safety of the neighborhood.

3,244
Communities
900,677
Units
840
Cities

688
Communities
186,219
Units
316
Cities

650
Communities
127,458
Units
260
Cities

621
Communities
106,267
Units
222
Cities

614
Communities
162,563
Units
237
Cities

550
Communities
128,104
Units
278
Cities
† Our analysis of utilities, groceries, transportation, healthcare, home prices, and other goods and services is sourced from the Cost of Living Index, a respected benchmark published by the Council for Community and Economic Research (C2ER) that provides a thorough overview of living expenses across different regions.
Rent data is provided by CoStar Group’s Market Trend reports. As the industry leader in commercial real estate information, analytics, and news, CoStar conducts extensive research to produce and maintain a comprehensive database of commercial real estate information. We combine this data with public record to provide the most up-to-date rental information available.
Consumer goods, services, and home prices are sourced from the Cost of Living Index published by the Council for Community and Economic Research (C2ER). The data on this page is updated quarterly. It was last published in February 2025.


