Median Age
33 Years
Largest Age Group
20-29 Years
Approximately 24% of Residents
Under 20
20%
Over 65
19%

Lebanon, Illinois carries the quiet confidence of a town that has seen centuries come and go without losing its sense of place. Roughly 30 minutes east of St. Louis, this small St. Clair County city of about 4,700 residents anchors itself around McKendree University, founded in 1828 as the oldest college in Illinois. The university gives Lebanon a steady intellectual pulse that a town of barely three square miles might not otherwise sustain, drawing students, staff, and cultural programming that keeps the community engaged year-round.
Downtown Lebanon reads like a preserved chapter of 19th-century American architecture, where Gothic, Italianate, Greek Revival, and Queen Anne buildings line the streets alongside the Mermaid House, a landmark that hosted Charles Dickens during his 1842 American tour. The Looking Glass Playhouse and the Hettenhausen Center for the Arts add a performing arts dimension. Scott Air Force Base, just 20 minutes away, adds another significant employment anchor to the area.
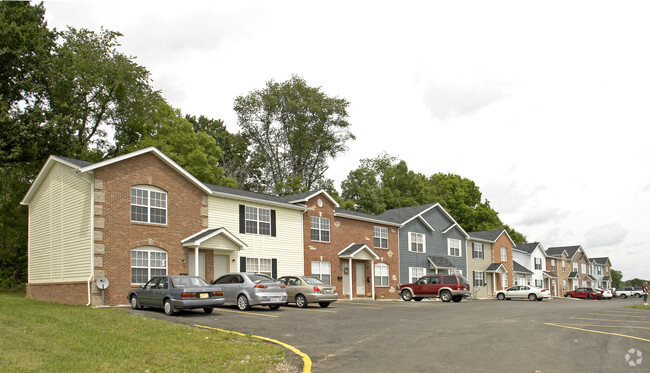
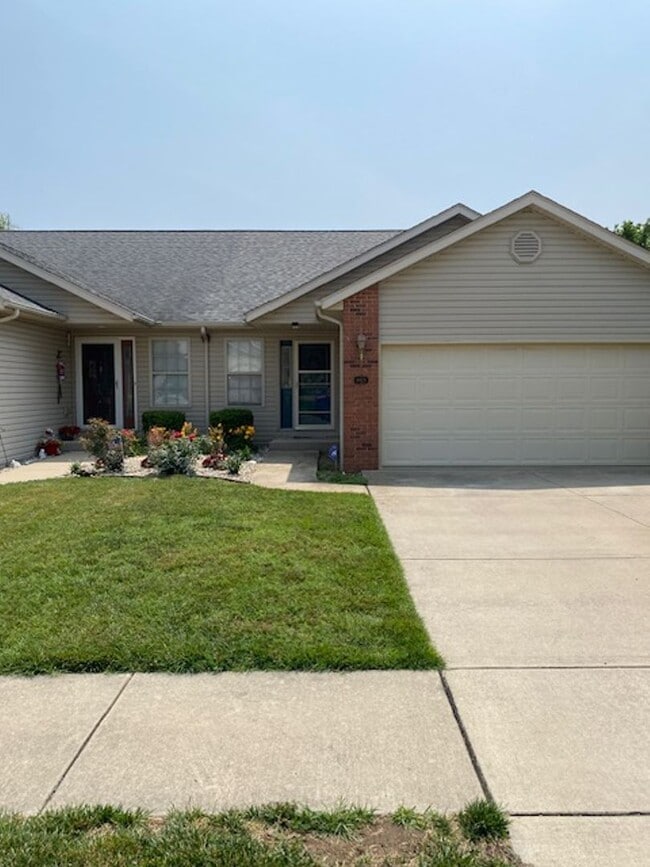
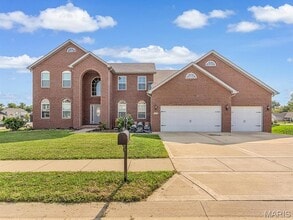
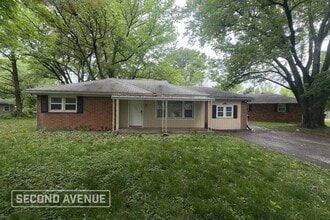
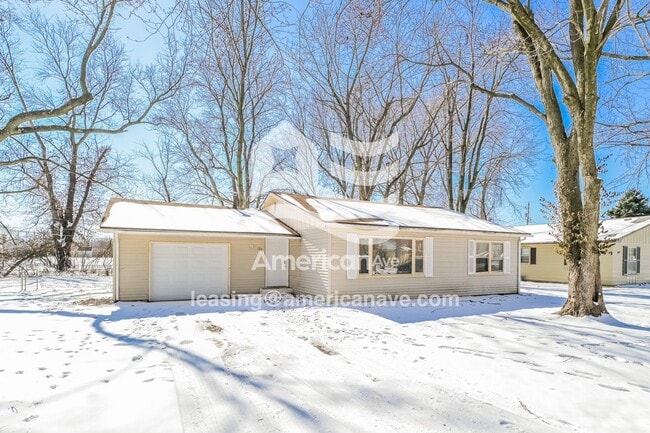
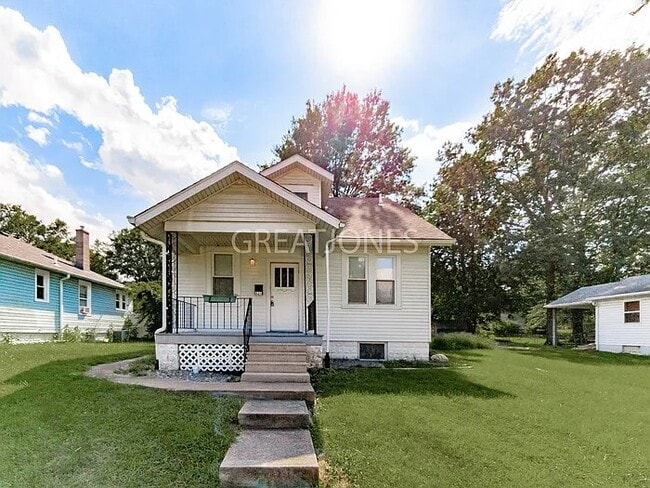
The rental market here reflects the town's scale: expect historic single-family homes and modest apartment communities. Renters gain access to the broader St. Louis metro while trading congestion for tree-lined streets, trail access, and a genuinely unhurried way of living.
Median Household Income
$82,052
Average: $96,018
Education
1,297
Residents Have a Degree
Job Market
2,182
Workers Employed
Median Age
33 Years
Largest Age Group
20-29 Years
Approximately 24% of Residents
Under 20
20%
Over 65
19%
Housing Distribution
Lebanon has more homeowners than renters.

Education Distribution
Review this city's overall education levels.

Explore how walkable, bikeable, drivable, and transit-friendly Lebanon, IL is for everyday living.
Somewhat Walkable
Walkability
Very Drivable
Drivability
Somewhat Bikeable
Bikeability

Public
Grades PK-5
303 Students

Public
Grades 6-12
213 Students

Public
Grades 6-12
213 Students
 The GreatSchools Rating helps parents compare schools within a state based on a variety of school quality indicators and provides a helpful picture of how effectively each school serves all of its students. Ratings are on a scale of 1 (below average) to 10 (above average) and can include test scores, college readiness, academic progress, advanced courses, equity, discipline and attendance data. We also advise parents to visit schools, consider other information on school performance and programs, and consider family needs as part of the school selection process.
View GreatSchools Rating Methodology
Data provided by
GreatSchools.org
© 2026. All rights reserved.
The GreatSchools Rating helps parents compare schools within a state based on a variety of school quality indicators and provides a helpful picture of how effectively each school serves all of its students. Ratings are on a scale of 1 (below average) to 10 (above average) and can include test scores, college readiness, academic progress, advanced courses, equity, discipline and attendance data. We also advise parents to visit schools, consider other information on school performance and programs, and consider family needs as part of the school selection process.
View GreatSchools Rating Methodology
Data provided by
GreatSchools.org
© 2026. All rights reserved.
† Our analysis of utilities, groceries, transportation, healthcare, home prices, and other goods and services is sourced from the Cost of Living Index, a respected benchmark published by the Council for Community and Economic Research (C2ER) that provides a thorough overview of living expenses across different regions.
Rent data is provided by CoStar Group’s Market Trend reports. As the industry leader in commercial real estate information, analytics, and news, CoStar conducts extensive research to produce and maintain a comprehensive database of commercial real estate information. We combine this data with public record to provide the most up-to-date rental information available.
Consumer goods, services, and home prices are sourced from the Cost of Living Index published by the Council for Community and Economic Research (C2ER). The data on this page is updated quarterly. It was last published in September 2026.
Demographic information comes from Neustar and combines detailed address data with U.S. Census and American Community Survey statistics to produce reliable local estimates.