Median Age
44 Years
Largest Age Group
50-59 Years
Approximately 15% of Residents
Under 20
22%
Over 65
20%

Avg Rent
$2,286
Population
42,610
Renter Mix
25% Rent
Few Southern California communities offer the particular kind of morning that Newbury Park does: a sunrise hike along a Chumash trade route through the Santa Monica Mountains, then a quiet drive home through tree-lined streets in time for breakfast. Sitting in the western portion of Thousand Oaks, about 35 miles from Downtown Los Angeles in the heart of the Conejo Valley, Newbury Park pairs mountain trail access with a relaxed suburban pace. Shopping plazas, casual restaurants, and well-kept green spaces fill out daily life, and the Ventura Freeway makes the wider region easy to reach.
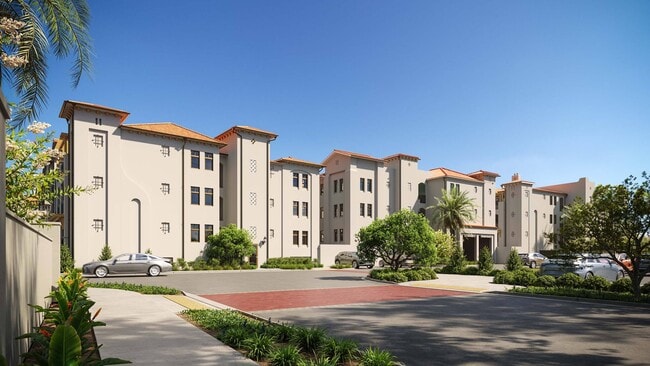
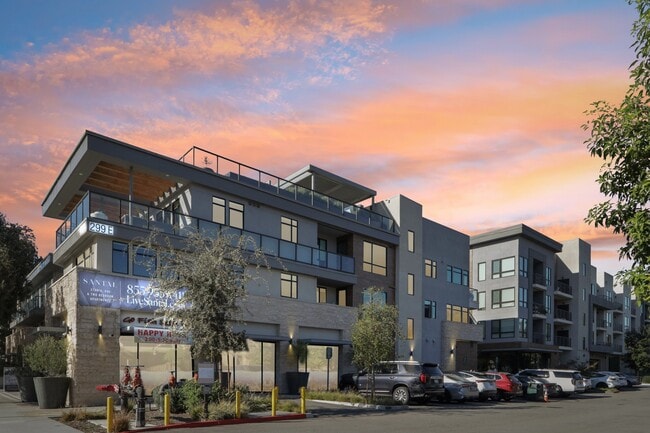
Rentals are mainly garden-style apartment communities spread across quiet residential blocks. The neighborhood's footprint means most buildings stay close to the ground, with an open, airy feel quite different from denser parts of Southern California.
Newbury Park makes up roughly 40 percent of Thousand Oaks' land area, and the city traces its roots to the Chumash people who inhabited the region some 7,000 years ago. California Lutheran University and CSU Channel Islands are both within a short drive, adding a steady cultural and academic presence to the surrounding valley.
Median Household Income
$134,623
Average: $161,753
Education
17,688
Residents Have a Degree
Job Market
22,689
Workers Employed
Median Age
44 Years
Largest Age Group
50-59 Years
Approximately 15% of Residents
Under 20
22%
Over 65
20%
Housing Distribution
Newbury Park has more homeowners than renters.

Education Distribution
Review this city's overall education levels.

As of September 2026, the average apartment rent in Newbury Park, CA is $2,020 for a studio, $2,282 for one bedroom, $2,750 for two bedrooms, and $3,623 for three bedrooms. Apartment rent in Newbury Park has decreased by -1.3% in the past year.
Explore how walkable, bikeable, drivable, and transit-friendly Newbury Park, CA is for everyday living.
Fairly Walkable
Walkability
Limited Public Transit
Transit
Exceptionally Drivable
Drivability
Fairly Bikeable
Bikeability

† Our analysis of utilities, groceries, transportation, healthcare, home prices, and other goods and services is sourced from the Cost of Living Index, a respected benchmark published by the Council for Community and Economic Research (C2ER) that provides a thorough overview of living expenses across different regions.
Rent data is provided by CoStar Group’s Market Trend reports. As the industry leader in commercial real estate information, analytics, and news, CoStar conducts extensive research to produce and maintain a comprehensive database of commercial real estate information. We combine this data with public record to provide the most up-to-date rental information available.
Consumer goods, services, and home prices are sourced from the Cost of Living Index published by the Council for Community and Economic Research (C2ER). The data on this page is updated quarterly. It was last published in September 2026.
Demographic information comes from Neustar and combines detailed address data with U.S. Census and American Community Survey statistics to produce reliable local estimates.