Median Age
41 Years
Largest Age Group
30-39 Years
Approximately 17% of Residents
Under 20
20%
Over 65
20%
Avg Rent
$1,321
Population
3,730
Renter Mix
54% Rent
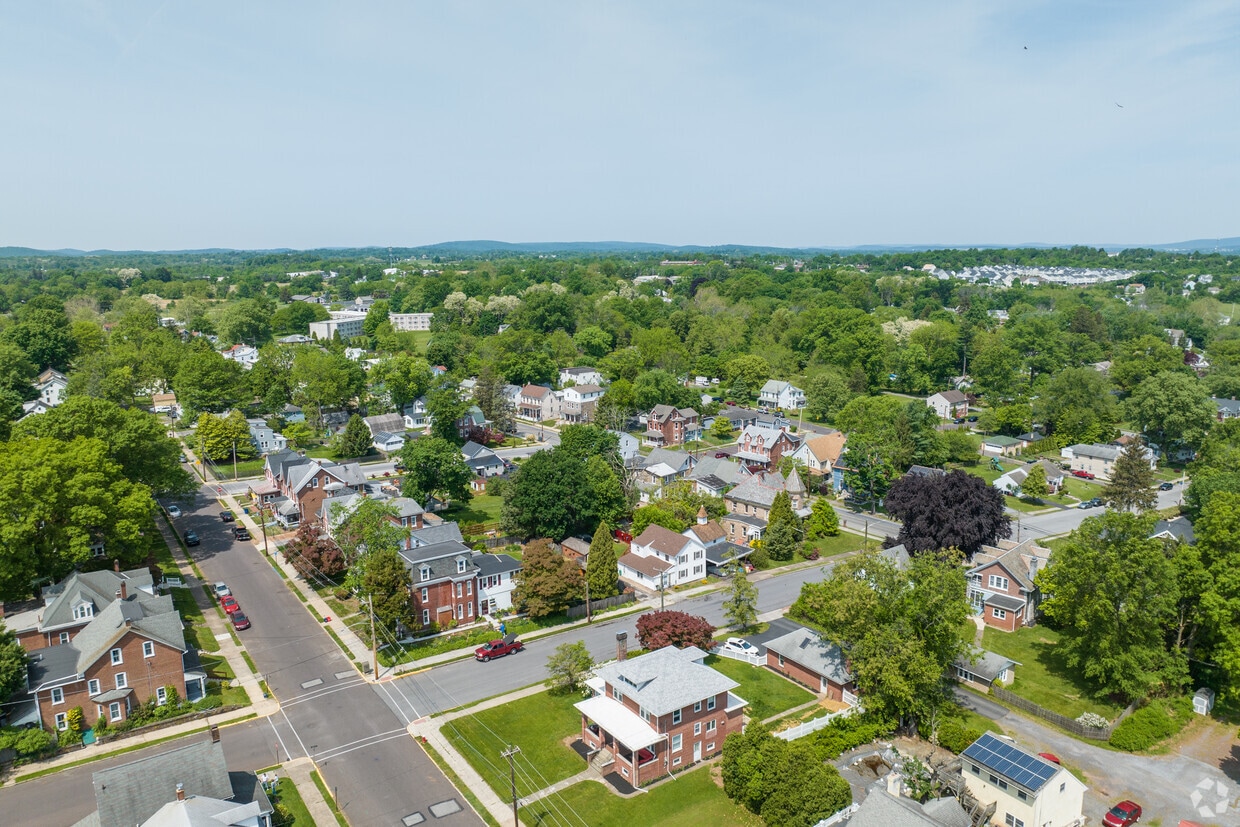
Sitting along the Schuylkill River about thirty miles northwest of Philadelphia, Spring City is a Chester County borough where small-town character and easy regional access go hand in hand. The surrounding landscape holds a mix of historic architecture and quiet residential streets, giving the area a grounded, unhurried feel that stands apart from busier suburban corridors nearby.
Spring City sits within the Spring-Ford Area School District, and its location near the Montgomery County border makes it a practical base for those working across the broader Philadelphia metro. The borough covers just one square mile, so the sense of a walkable, close-knit community is built right into its layout. Across the Schuylkill River, the neighboring borough of Royersford adds to the network of surrounding amenities and services.
Renters looking for character-rich spaces with historic details will find plenty of options here. The borough's compact footprint and affordable positioning relative to the broader Pennsylvania rental market make it an appealing home base for anyone who wants proximity to a major metro without trading away a quieter pace of life.
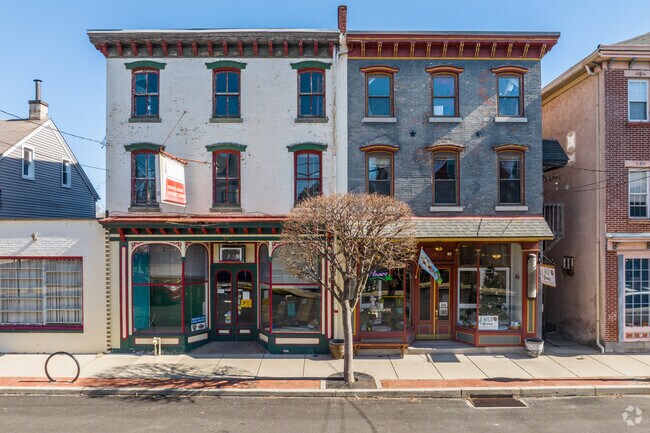
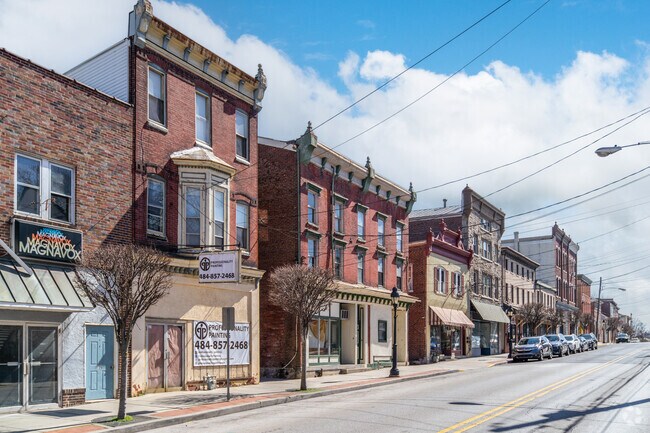
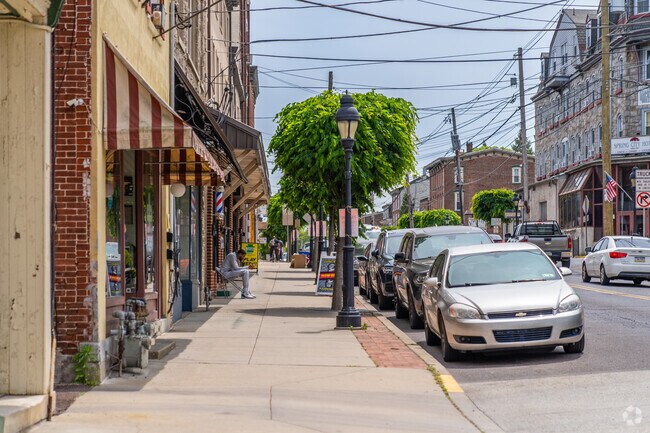
Spring City's Main Street features many local businesses including several restaurants.
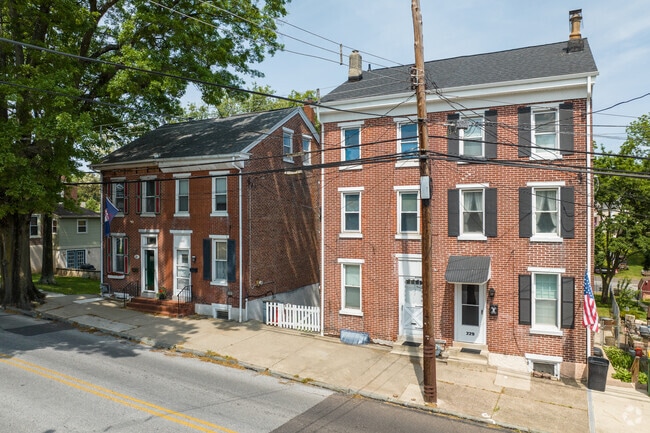
The residential blocks closest to Main Street in Spring City are filled with Colonial Style Twins and Row Homes.
The tree-lined Main Street in Spring City is like a time capsule from generations past.
Various styles of Twin and Row Homes are the dominant residential offerings in Spring City.
The Spring City River Park provides beautiful view of the Schuylkill River.
Spring City is a bustling neighborhood with friendly residents and activities year-round.
Median Household Income
$68,763
Average: $83,251
Education
1,017
Residents Have a Degree
Job Market
2,153
Workers Employed
Median Age
41 Years
Largest Age Group
30-39 Years
Approximately 17% of Residents
Under 20
20%
Over 65
20%
Housing Distribution
Spring City has more renters than homeowners.

Education Distribution
Review this city's overall education levels.

As of July 2026, the average apartment rent in Spring City, PA is $1,069 for a studio, $1,320 for one bedroom, $1,429 for two bedrooms, and $1,225 for three bedrooms. Apartment rent in Spring City has increased by 1.2% in the past year.
Explore how walkable, bikeable, drivable, and transit-friendly Spring City, PA is for everyday living.
Somewhat Walkable
Walkability
Limited Public Transit
Transit
Exceptionally Drivable
Drivability
Fairly Bikeable
Bikeability
East Vincent Elementary School
Public
Grades K-5
512 Students

Public
Grades K-5
519 Students

Public
Grades K-5
157 Students
† Our analysis of utilities, groceries, transportation, healthcare, home prices, and other goods and services is sourced from the Cost of Living Index, a respected benchmark published by the Council for Community and Economic Research (C2ER) that provides a thorough overview of living expenses across different regions.
Rent data is provided by CoStar Group’s Market Trend reports. As the industry leader in commercial real estate information, analytics, and news, CoStar conducts extensive research to produce and maintain a comprehensive database of commercial real estate information. We combine this data with public record to provide the most up-to-date rental information available.
Consumer goods, services, and home prices are sourced from the Cost of Living Index published by the Council for Community and Economic Research (C2ER). The data on this page is updated quarterly. It was last published in June 2026.
Demographic information comes from Neustar and combines detailed address data with U.S. Census and American Community Survey statistics to produce reliable local estimates.


