Median Age
44 Years
Largest Age Group
60-69 Years
Approximately 14% of Residents
Under 20
21%
Over 65
23%

Avg Rent
$1,474
Population
54,245
Renter Mix
16% Rent
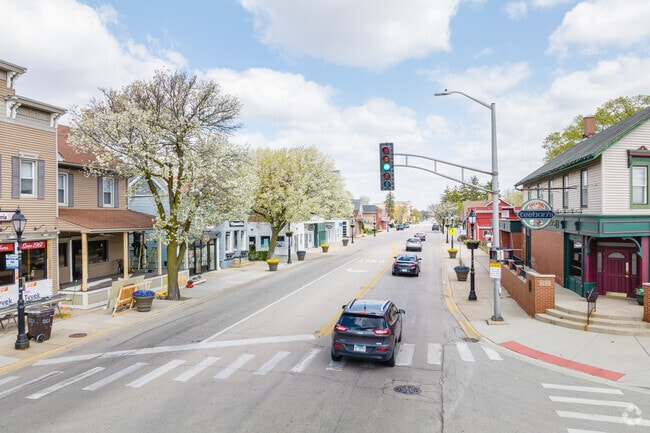
Tinley Park has built a reputation as one of the Chicago area's most welcoming and well-rounded communities, sitting about 25 miles southwest of downtown Chicago in Cook and Will counties. The village draws people who want access to a major city without sacrificing a sense of place, and its compact downtown district delivers just that with a walkable main street feel that keeps the community grounded.
The local economy benefits from a solid mix of retail, healthcare, and light industry, and the village's proximity to major employment corridors along Interstate 80 makes commuting to surrounding suburbs equally practical. Moraine Valley Community College, located just minutes away, adds an educational anchor that shapes the intellectual and cultural energy of the broader southwest suburban region.
Housing in Tinley Park spans a wide range, from established single-family neighborhoods and townhome communities to modern apartment communities that have grown in step with demand. Renters will find well-maintained apartment communities offering everything from cozy one-bedroom layouts to more spacious multi-bedroom floor plans, often with updated finishes and outdoor amenities. The Credit Union 1 Amphitheatre (formerly Hollywood Casino Amphitheatre), one of the country's top-ranked outdoor music venues, calls Tinley Park home, giving the village an entertainment identity that extends well beyond its borders.
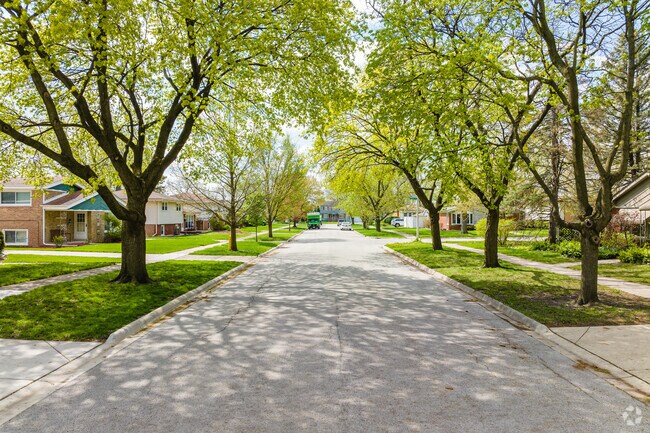
Tinley Park has many lush, tree-lined streets in the neighborhood.
Downtown Tinley Park is adorned with blooming trees.
Tinley Park residents take advantage of a nice winter day in Yankee Woods Forest Preserve.
Tinley Park Public Library is open 7 days a week.
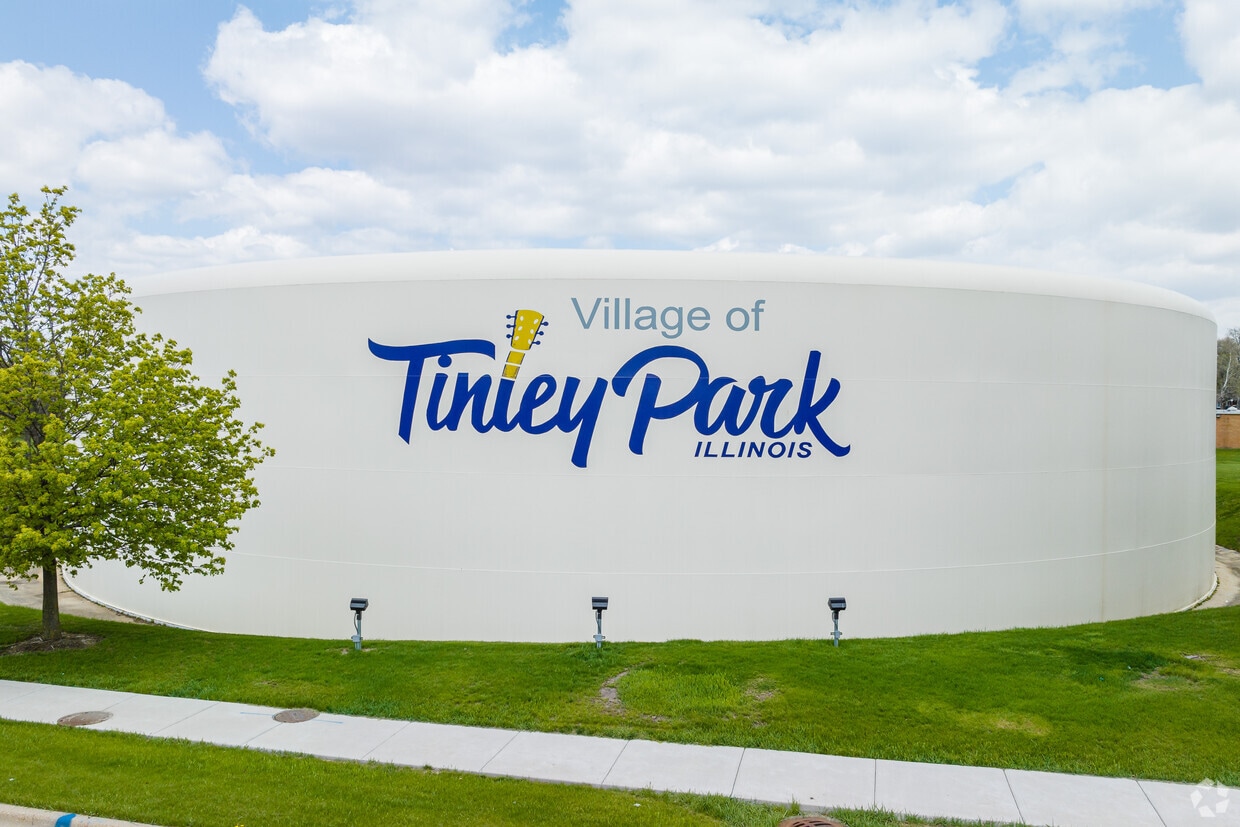
Tinley Park was officially incorporated in 1892.
Tinley Park is located in the southwest suburbs of Chicago.
Median Household Income
$91,838
Average: $113,287
Education
16,677
Residents Have a Degree
Job Market
29,992
Workers Employed
Median Age
44 Years
Largest Age Group
60-69 Years
Approximately 14% of Residents
Under 20
21%
Over 65
23%
Housing Distribution
Tinley Park has more homeowners than renters.

Education Distribution
Review this city's overall education levels.

As of July 2026, the average apartment rent in Tinley Park, IL is $977 for a studio, $1,474 for one bedroom, $1,662 for two bedrooms, and $2,114 for three bedrooms. Apartment rent in Tinley Park has increased by 3.1% in the past year.
Explore how walkable, bikeable, drivable, and transit-friendly Tinley Park, IL is for everyday living.
Somewhat Walkable
Walkability
Good Public Transit
Transit
Exceptionally Drivable
Drivability
Moderately Bikeable
Bikeability
Public
Grades PK-5
484 Students

Public
Grades PK-5
468 Students
John A Bannes Elementary School
Public
Grades PK-5
416 Students

Helen Keller Elementary School
Public
Grades PK-5
411 Students
Public
Grades PK-5
309 Students
Public
Grades 6-8
724 Students
Virgil I Grissom Middle School
Public
Grades 6-8
623 Students
Public
Grades 6-8
576 Students
Public
Grades 9-12
972 Students
† Our analysis of utilities, groceries, transportation, healthcare, home prices, and other goods and services is sourced from the Cost of Living Index, a respected benchmark published by the Council for Community and Economic Research (C2ER) that provides a thorough overview of living expenses across different regions.
Rent data is provided by CoStar Group’s Market Trend reports. As the industry leader in commercial real estate information, analytics, and news, CoStar conducts extensive research to produce and maintain a comprehensive database of commercial real estate information. We combine this data with public record to provide the most up-to-date rental information available.
Consumer goods, services, and home prices are sourced from the Cost of Living Index published by the Council for Community and Economic Research (C2ER). The data on this page is updated quarterly. It was last published in June 2026.
Demographic information comes from Neustar and combines detailed address data with U.S. Census and American Community Survey statistics to produce reliable local estimates.


