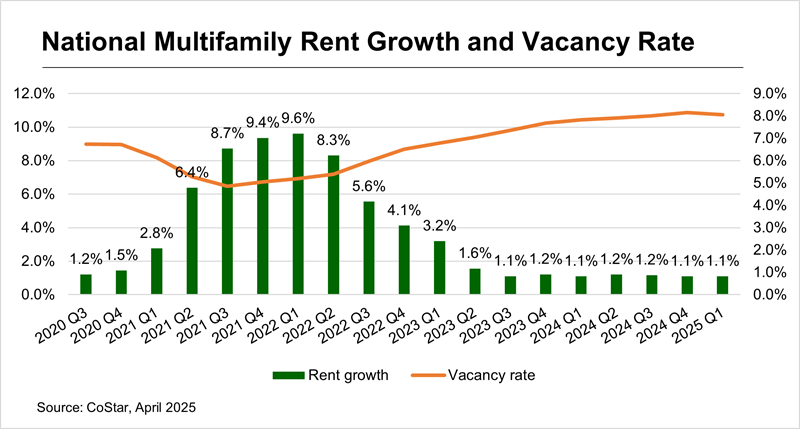
Rent growth and vacancy continue to hold steady, according to the latest CoStar data for the first quarter. The multifamily market saw no change in year-over-year rent growth or vacancy, with asking rates remaining at 1.1 percent nationally and vacancy continuing to average 8.1 percent.
Despite this plateau, the Q1 data revealed signs of increased demand. Compared to the first quarter last year, absorption grew 12.8 percent. In total, 137,750 units were absorbed in Q1 2025, and three-quarters of these units were in the luxury class. Also known as four- and five-star properties, this category has borne the brunt of the recent supply wave.
Supply additions peaked last year at a 40-year record. In the first quarter of this year, supply has continued to outpace demand, with a total of 140,950 units added. But in a positive sign for multifamily owners and operators, the supply–demand gap has continued to narrow.
Plateau in rent growth reflects years-long trend
After a dramatic runup during the COVID-19 pandemic, rent growth fell to 1.1 percent in the third quarter of 2023. Since then, it has hovered between 1.1 and 1.2 percent for seven straight quarters.
Although vacancy has seen bigger shifts, it too has stabilized. The national average held steady at 8.1 percent from the previous quarter.
Mid-priced properties have continued to outperform both the national average and the top end of the market. These properties, known as three-star apartments in CoStar’s building rating system, saw rent growth of 1.4 percent. In contrast, asking rents for four- and five-star apartments grew by only 0.5 percent.
At 7.4 percent, vacancy for the middle of the market remained below the national average, while the luxury apartments saw double-digit vacancy at 11.4 percent.
Midwest and Northeast lead rent growth charts

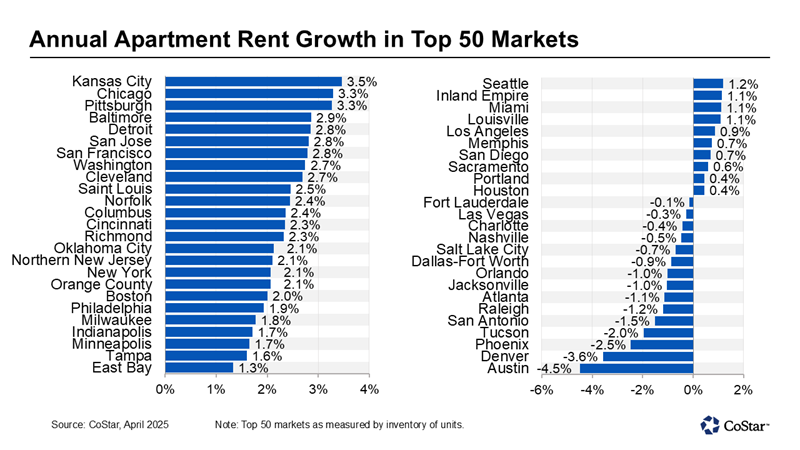
At the regional level, the Midwest and Northeast continued to outperform the nation. With 3.5 percent, the Midwestern market of Kansas City took the took spot for year-over-year rent growth, closely followed by Chicago and Pittsburgh at 3.3 percent.
Read more: Top 10 Multifamily Markets for Rent Growth as of February 2025
While the list of top performers is dominated by Midwest and Northeast markets, a few California markets — representing the West region — have crept up in the charts:
- San Jose and San Francisco posted 2.8 percent, ranking sixth and seventh.
- Orange County, which also saw a strong performance in 2024, posted 2.1 percent.
- Recovering from its negative performance last year, the East Bay posted just above the national average with 1.3 percent rent growth.
The Sun Belt struggle continues
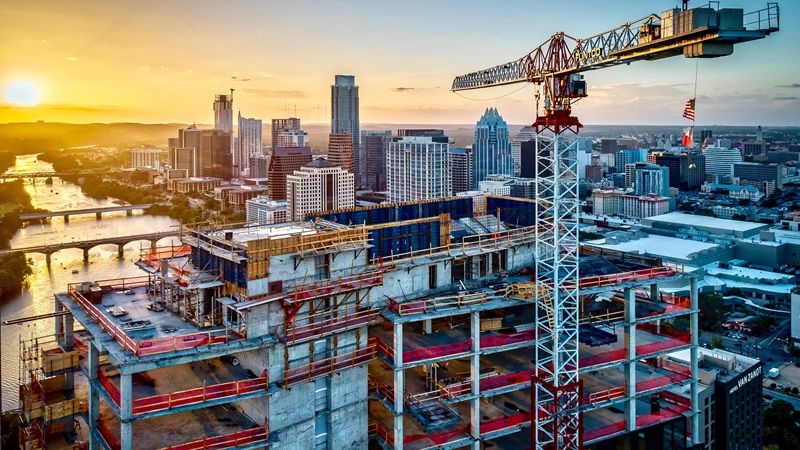
At the other end of the chart, the bottom-performing markets were overwhelming in the Sun Belt. Austin saw the largest year-over-year drop, with rents falling 4.5 percent. Challenging conditions remain in the Texas capital, although the rate of deceleration has slowed slightly as the supply pipeline has begun to ease.
Nearly all of the major markets with rent declines are found in the Sun Belt. After a development boom that kicked off during the pandemic, major Sun Belt markets have seen an influx of new supply, pushing asking rents into negative territory.
In Phoenix, asking rents dropped 2.5 percent year over year, while Tucson and San Antonio saw drops of 2 percent and 1.5 percent, respectively.
Read more: What’s Behind the Cloudy Outlook for the Sun Belt?
Two markets outside the Sun Belt ranked among the 12 lowest performing markets. With a year-over-year rent decline of 3.6 percent, Denver was the second worst-performing market after Austin. And in 11th place from the bottom, Salt Lake City saw rents drop by 0.7 percent.
Want more market insights?
CoStar is the industry-leading source for information, analytics, and news about all areas of commercial real estate. Whether you’re an owner, investor, or apartment operator, you’ll find in-depth analysis from multifamily experts to help you stay on top of the latest trends in the market. Learn more about CoStar.


