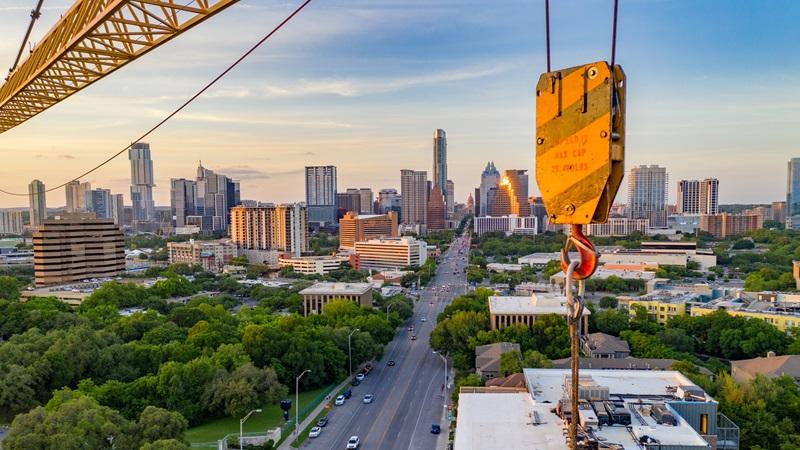
Of all the multifamily markets in the Sun Belt, none illustrate today’s tough conditions quite like Austin. Asking rents in the Texas capital have been falling faster than in any other major market, and Austin has led the nation for months with the highest multifamily vacancy rate. What’s behind these trends in Austin? Here’s a closer look at the situation and what it means for apartment owners and operators.
Austin faces the toughest conditions in the nation
Austin holds the unenviable position of leading the nation for vacancy and negative rent growth.
As of the third quarter, Austin took the top spot for highest vacancy among major markets, with an overall multifamily vacancy rate of 15.4 percent. The markets in second and third place, Memphis and Jacksonville, had vacancy rates of 13.8 and 13.5 percent, respectively.
Highest vacancy rates among major multifamily markets (Q3 2024)
Rank | Market | Vacancy rate |
1 | Austin, TX | 15.4% |
2 | Memphis, TN | 13.8% |
3 | Jacksonville, FL | 13.5% |
4 | San Antonio, TX | 13.5% |
5 | Atlanta, GA | 12.4% |
Austin has also seen asking rents fall more dramatically than in any other major market. In the third quarter, Austin posted a year-over-year 4.6 percent drop in asking rents. That was nearly double the decline of the next closest market, Raleigh, which saw a drop of 2.7 percent.
Lowest rent growth among major multifamily markets (Q3 2024)
Rank | Market | 12-month asking rent growth |
1 | Austin, TX | -4.6% |
2 | Raleigh, NC | -2.7% |
3 | Jacksonville, FL | -2.3% |
4 | Phoenix, AZ | -1.1% |
5 | Atlanta | -1.8% |
The oversupply problem facing Austin
How did conditions in Austin grow so extreme? Record-high supply is the primary factor driving the skyrocketing vacancy and tumbling rents.
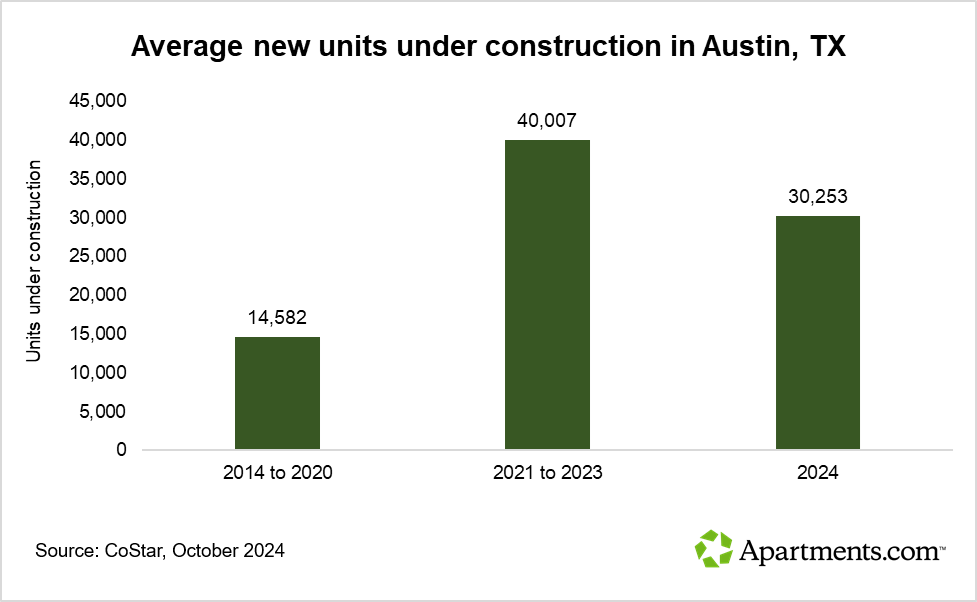
From 2014 through 2020, the Austin multifamily market saw an average of 14,600 units under construction per quarter. As the population swelled during the pandemic, developers responded with a growing number of new construction projects.
Between 2020 and 2022, the Austin metro added over 121,000 people, an increase of 5.3 percent, according to the Austin Chamber of Commerce.
Development skyrocketed. From 2021 to 2023, the average number of units under construction per quarter jumped to 40,000 — more than three and a half times more units than the average from 2014 to 2020.
In the first quarter of 2023, Austin saw a whopping 54,000 multifamily units under construction — 20 percent of its total inventory at the time.
As new deliveries come online, the construction pipeline has slowed somewhat. In the first three quarters of this year, the average number of units under construction fell to 30,200 per quarter. This 25 percent drop is a positive sign for the future, but the Austin market remains swamped by new supply.
As of the third quarter, Austin has the highest rate of total multifamily units relative to population of any major market. Despite having only 0.7 percent of the nation’s population, the metro delivered 5.8 percent of the nation’s gross deliveries in the third quarter, according to the latest CoStar data.
Why did multifamily development explode in Austin?
New residents flocked to the Austin area during the pandemic. This reflected a nationwide migration to the Sun Belt, but Austin saw its population increase more dramatically than any other Sun Belt market. The Austin metro had the largest relative increase in population of all major metros between 2020 and 2022, according to the Austin Chamber.
The Texas capital attracted new residents from Houston, Dallas, Los Angeles, the San Francisco Bay Area, and other metros near and far. The area is known for its thriving music scene, vibrant cultural life, and emergence as a tech hub.
Over the years, the Austin metro has caught the eye of technology leaders such as Apple, Dell, IBM, Oracle, Samsung, and Tesla. Austin’s low cost of living, limited taxes, and pro-business environment have made it an appealing location for employers.
Other factors contributing to Austin’s rapid multifamily growth include its high permitting rate, ample land for development, and relatively high rate of renters to homeowners. Austin is also one of the youngest major metropolitan areas, with a median age of 35.9.
How Austin stacks up against other markets
Until 2022, Austin typically saw above-average rent growth relative to the national average. (Rent growth dipped during the uncertainty of the pandemic shutdowns of 2020 but appeared to bounce back by 2021.) But in the last few years, Austin’s rent growth has tumbled far below the national average and below even that of fellow Sun Belt markets.
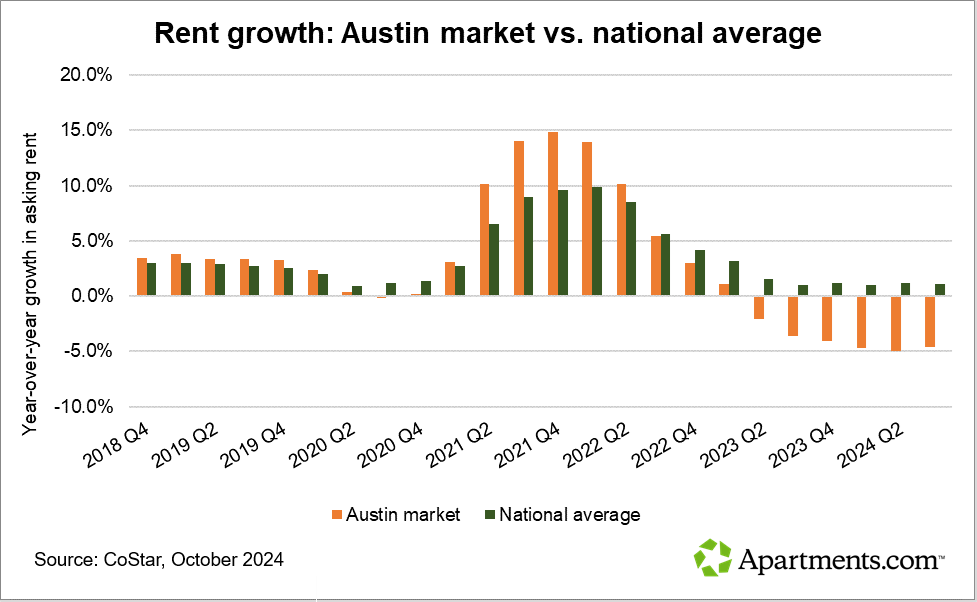
Austin isn’t the only market that has been struggling. Challenges with high supply and declining rents have plagued other markets across the Sun Belt.
How is the rest of the state doing? Texas has 25 multifamily markets, according to CoStar data. This includes both major and minor markets.
Three of the four major markets — Austin, San Antonio, and Dallas-Fort Worth — are facing rent declines. Houston is the only major market to see rent growth in the black, at a modest 0.7 percent in the third quarter. All four major Texas markets, however, are seeing vacancy in the double digits.
But compared to all Texas markets large and small, Austin has seen the largest rent declines and highest vacancy across the board.
Lowest rent growth among all Texas multifamily markets
Rank | Market | Rent growth | Vacancy |
1 | Austin, TX* | -4.6% | 15.4% |
2 | Killeen, TX | -2.3% | 14.9% |
3 | San Antonio, TX* | -1.8% | 13.5% |
4 | Dallas-Fort Worth, TX* | -1.2% | 10.9% |
5 | Sherman-Denison, TX | 0.0% | 15.1% |
6 | Tyler, TX | 0.2% | 8.7% |
7 | Corpus Christi, TX | 0.3% | 13.2% |
8 | Lubbock, TX | 0.5% | 13.2% |
9 | McAllen, TX | 0.6% | 9.6% |
10 | Waco, TX | 0.7% | 10.2% |
11 | Houston, TX* | 0.7% | 11.0% |
12 | Wichita Falls, TX | 0.9% | 12.2% |
13 | Longview, TX | 0.9% | 12.9% |
14 | San Angelo, TX | 1.8% | 8.7% |
15 | Amarillo, TX | 1.8% | 10.9% |
16 | Victoria, TX | 2.0% | 7.5% |
17 | Texarkana, TX | 2.4% | 7.6% |
18 | El Paso, TX | 2.8% | 5.1% |
19 | Beaumont, TX | 3.1% | 11.7% |
20 | College Station-Bryan, TX | 3.3% | 7.7% |
21 | Brownsville-Harlingen, TX | 3.4% | 5.1% |
22 | Abilene, TX | 3.4% | 9.8% |
23 | Laredo, TX | 3.7% | 5.3% |
24 | Midland, TX | 4.1% | 7.1% |
25 | Odessa, TX | 5.3% | 7.9% |
*Major U.S. multifamily market
2025 offers signs for optimism
How long will the decline last? Although the recovery in Austin is expected to be slow, there is light at the end of the tunnel. Rent growth is expected to turn positive by the third or fourth quarter of 2025.
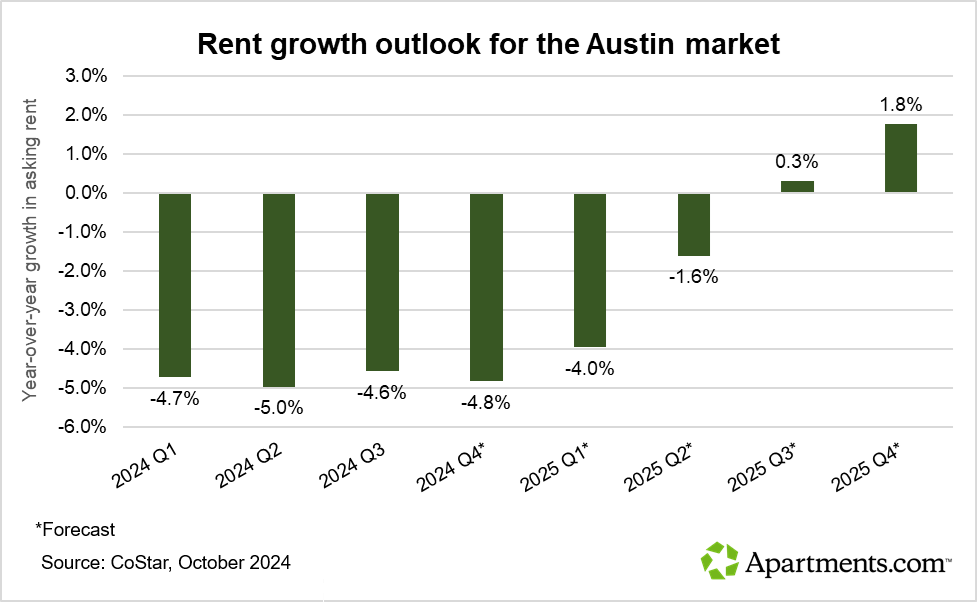
The slowing construction pipeline will allow renter demand to gradually absorb excess supply, bringing Austin rent growth back into the black.
Looking for more insights?
For more analysis of multifamily trends in Austin and around the country, check out the latest state of the multifamily market webinar with CoStar’s Jay Lybik, national director of multifamily analytics.
CoStar is the industry-leading source for information, analytics, and news about all areas of commercial real estate. Whether you’re an owner, investor, or apartment operator, you’ll find in-depth analysis from Jay Lybik and other experts to help you stay on top of the latest trends in the market. Learn more about CoStar.


